Detailed Analysis of PV Solar from an EROI Perspective
Introduction
This post is based on a book titled "Spain’s Photovoltaic Revolution - The Energy Return on Investment" by Pedro Preito & Charles Hall. For those who’ve not heard of Charles Hall, he is something of an icon in the field of biology and energy research after formalizing the concept of Energy Return on Investment (EROI) or sometimes EROEI “energy invested”. His work started with the study of fish and determined that they gained 4 calories for each one expended by swimming upstream to areas that had more lucrative food sources. This book looks at the investment in PV solar by Spain from the same perspective. While the solar power plants produce a lot of energy, the question is what the net gain is from the system.I think we’ve all heard that it take 3 or 4 miles of jogging to burn off one chocolate chip cookie, so this is a similar concept. It asks how much energy we’re willing to expend in order to receive a net benefit. Clearly, running 1 mile and being rewarded with a cookie is worth it, while most would pass up running a half marathon only to be rewarded with a cookie at the end.
As the world looks and its future energy needs, the question is whether we’re making the right choices and pursuing energy sources that have sufficient EROI to support the standard of living we’ve become accustomed to. As Hall and others look at the problem, it’s not clear we’re making the right choices, and this study of Spain’s massive investment in solar power is a deep and detailed look at whether or not that investment made sense.
As he says in the introduction to the book:
“An important question is whether renewable sources of energy, when they are not being subsidized*, can deliver enough surplus energy to society for them to be competitive with "depletable" an and perhaps dangerous fossil fuels. But what if the EROI of these alternative energy sources are small compared to the fuels they are replacing? And what would too low mean to society?"
*Subsidized has many different meanings depending on whether there are direct cash payments, tax incentives, guaranteed rates, or other incentives involved. Regardless of that, what is very clear is the interdependence between renewables and fossil fuels as the rest of this post will try to make clear. There aren’t any solar powered concrete mixers or bull dozers and there never will be.
Society's Hierarchy of Energetic Needs
Hall has a pyramid showing what levels of EROI are returned by various energy sources and what level of society is supported. For example, if EROI is 1:1, you can pump oil out of the ground and look at it. It takes a much higher return on investment to cover the associated costs of the supply chain related to the oil industry including costs of all the personnel, equipment, and other infrastructure that is embedded in that gallon of gas you pump into your car.

Spain’s solar program represents a unique system in which it is relatively isolated from cross border power, had a very large buildup in a short period, and had very good data collection by the government that allowed a detailed analysis. If you take the time to read the book, you’ll find out at least 20 factors affecting the total energy output of Spain’s solar energy system ranging from factors absorbing 0.22% of the power produced like washing the solar panels or 5.6% of the power loss due to the power inverters. There are many economic analyses of renewable energy, but this one is perhaps the most comprehensive in terms of identifying inputs and outputs of the system. The net result is:
“The sum of all energy used on a yearly basis to generate Spain’s PV electricity, calculated using our broad boundaries and with the assumption that wherever money is spent energy must flow, is a total of 2,065.3 GWe of net useful energy to society. This equals 40.8% of all the yearly energy generated by the solar PV plants of Spain."
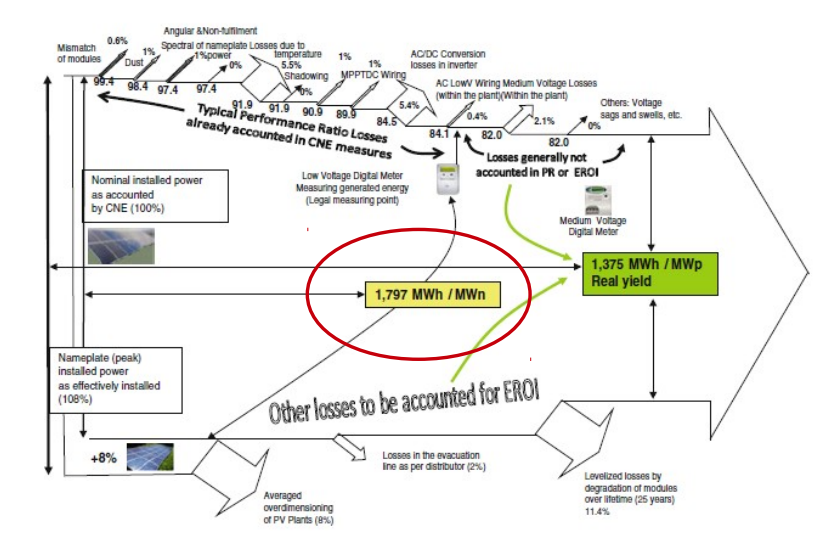
And we’ll dive into more of the details below, but in short, they identify a long list of that reduce the output of the solar PV systems to 76.5% of the rated power. Some of the factors will be discussed below, but they include: mismatch of modules, dust, loss due to temperature, AC/DC conversion, wiring within the plant and shadowing. However, among these factors, the analysis is very conservative and rates some of the factors at zero loss due to not having a good way to measure the losses or enough data on future reliability of key components like power inverters that can only be observed over a longer time period. Or, for example, the impact of dust was estimated at 1% loss while some manufacturers calculate the factor at 4 - 12% on average and up to 25% in severe conditions.
Beyond these factors that affect the output side of the equation, there are a significant number of energy requirements that go into building a solar PV system that have to be accounted for in the EROI calculation. The construction of the site, shipping of the components, connection to the electrical grid, insurance, administration, and ongoing maintenance are also factors that must be “paid back” over time or during operation for the investment to pay off.
Samples of Factors Included in Estimating EROI
Accesses, foundations, canals, fences and other infrastructure
Building a solar PV plant requires a significant amount of conventional construction of roads, access ways, foundations for the panel, canals and drainage, and fences around the facilities. Of course, this is built up front, but the annual impact of this construction amortized over the planned 25 year lifecycle is 1.1% of total energy output. Note that this figure does not include estimates for repair or upkeep of the roads or other elements that may require future investment.
Transportation costs incurred building the PV plants
Spain’s solar PV efforts were very concentrated over a short 3 - 4 year time period and there were various incentives to build plants to meet deadlines to receive subsidies or meet other objectives. As a result, beyond all the ships, trucks, cranes, tractors, and other transportation involved, there was a significant amount of air shipment of solar PV cells. That added significantly to the energy cost of building the system, the ships that delivered many of the panels from China are estimated to have used 95GWh of energy, but the 5% of panels delivered via air freight used approximately 756 GWh.
Adding together all the transportation costs, the overall amount is equal to 1.9% of annual energy output if amortized over the 25 year life of the system.
“The important thing, here, is … to show that this type of energy is still absolutely dependent on a very complex, interlinked fossil fuel society, for which, nobody has seen a reasonable, functional replacement with modern renewable energies.”
Water - washing the solar panels
One thing that is required is to wash the solar panels so that they do not lose efficiency due to dust buildup. The water used in this effort must be specially processed so that it does not leave behind mineral deposits, which increases the energy consumed. Also, there is the Murphy’s law aspect of washing the panels only to have a dust storm come up just days after the planned cleaning cycle. Estimating 4 washings per year, the energy cost of the water, trucks, and other components necessary is equal to 0.22% of annual energy output.
Degradation of modules over time
The contracts from the manufacturers typically assume a 1% degradation per year up to a 20% maximum over the theoretical 25 year life cycle. In some cases, a 3% degradation was seen in the first year along with a certain amount of “infant mortality” of new panels that had to be replaced due to failure. Whether or not this level of reliability will be obtained is unclear. In addition, because there was a boom and bust cycle in the solar industry, many companies that might have otherwise serviced these panels have gone out of business. The industry went from 41,700 full-time job in 2008 to 11,300 jobs in 2009, and even if companies remained viable during this phase, they could be challenged if modules degrade too quickly and need to be replaced under service contracts.
Other infrastructure - gas turbine backups
The business plans for combined cycle gas power plants are usually designed with the assumption to amortize their cost over their lifecycle (25- 40 years) due to their complexity, while requiring a smooth and efficient operation of a minimum of 5,500 nominal hours in a year. Although initially they reached some 4,000 nominal hours a year, suddenly things started to change, when renewables, led by wind, with a lot of intermittencies, passed 10% of the demand in 2008. [Note: some sites fell to as low as 2,500 hours in 2010.]
"These investments … are working less than half of the time as drafted in the business plan. This is in part because the combined cycle gas plants are now forced many hours in a year to work in “complementary intermittent regime” to compensate for the steep variations of wind and solar: switching them off when there is oversupply if the wind blows and/or the sun shines and switching them on again if there is a calm wind and or clouds in the sky. … In fact, a night/day cycle, sometimes obliges these plants to switch off in the night and switch on in standby mode several hours before dawn when consumption ramps up. The natural gas used to keep up this “spinning reserve” is simply wasted, and it is obvious that these regimes of continuous and frequent switch on/offs shortens the expected lifecycle of these complex dual gas cycle plants …."
And this is no small consideration. If investments are made with a planned lifecycle and that period is truncated or the expected utilization does not match the plan, then the cost factors must all be recalculated to reflect the true cost (which can increase dramatically). If these resources are not used efficiently, one obvious outcome would be higher utility bills, but another factor would be whether the companies operating the gas plants are economically viable under the rate regimes allowed by the government.
Dealing with intermittency
Intermittency, or the lack of consistent power output that matches demand is a key concern in adding renewables to the power grid. Solar has the "night problem" and wind has calm days. In addition, some of the peak power generated by solar is not matched well with the time of day of the demand (morning and evening are high demand, while solar peaks power during midday). As such, if these technologies are going to be the solution, then energy storage is going to be crucial in managing the peaks and valleys of energy demand. A few quotes:
"If PV solar systems are supposed to be the long-term replacement of fossil fuels in the future … we must consider backup or storage systems."
"In Spain there are presently [2009] some 2,750 MW of installed power to pump up water from a lower to an upper reservoir, which can then be released during the periods of maximum need. Some 30% less energy is generated than is used to elevate the water …."
"The installed capacity consumed 1.34% of the total energy generated in Spain and in so doing the losses were 1,111GWh/year or about 20% of the solar electricity generated."
The stored hydro were originally built to take advantage of the excess power that the nuclear plants generate overnight and then the hydro power is used to cover peaks during the day when demand exceeds the "base load" provided by nuclear, coal, or gas power plants. Solar doesn’t fit this demand curve as the peak demand and production coincide and there is no solar based power to pump water at night. As such, it is a concern whether this type of storage is viable. Nevertheless, the REE (regulator) calculated that the hydro power backups need to increase to 6,577 MW to cover planned renewable developments through 2020. The cost of building this infrastructure is itself significant and it remains to be seen whether there are sufficient sites where this type of hydro storage can be built.
In the analysis, they calculated the addition of storage as zero cost “for now, but it could be large”. Indeed, the cost of building a pumped hydro storage system would be significant, and the 30% energy loss incurred when using the system is significant meaning that significant overcapacity needs to exist in order to cover this loss than if the power could be used directly by the grid. Finding a way to manage these systems with intermittent inputs rather than the stable power produced by nuclear, coal, or gas plants would also be a significant challenge.
Electrical Grid
Using the basis that solar provided 2.25% of the total power to the grid in 2009, they calculate that 3.5% of energy output is being absorbed by the grid and its maintenance. Since the solar PV penetration was planned to increase, the amount of energy associated with the grid would also increase. Whether this is a linear cost curve depends on factors like managing intermittency and the geographic dispersion of the solar plants. They further they are from population centers, the higher the cost.
Other Economic Activity
As noted by the authors, the economic analysis is very broad and considers that if money is flowing, then so is energy. Therefore, other factors supporting the solar PV systems include financial transfers or the employment of people who perform services associated with the industry. Examples include:
- Insurance 0.4%
- Promotions and conferences 0.5%
- Administration expense 0.7%
While some of these factors may be no more or less energy intensive that other energy sources, they do factor into the overall EROI calculation. The more human energy required to service or maintain the solar PV systems, the more of a cost to society. In other words, all the people employed by activities above own homes, drive cars, work in offices, and otherwise consume energy. The larger the footprint, the lower the EROI, which runs somewhat counter to the argument about "green jobs". In many cases renewable energy has a much lower EROI and as such increasing the number of jobs in the sector makes it less viable as an alternative.
Miscellaneous - Ground vs Rooftop
While Spain built much of its solar PV with dedicated facilities, Germany took a rooftop approach for most of its installations. Beyond the fact that Germany has ~30% less irradiance that Spain due to both climate and geography, the rooftop installations themselves were less efficient due to improper tilting and shadowing effects.
“In many cases, the installations are using all the the available roof sites while supply relatively little power."Based on the calculation of an EROI for Spain of 2.45 and its superior form of solar energy along with better geographic factors, there are some that suggest the EROI for Germany could be negative.
Summary
As long as this post is, I've left out far many more details than I've put in. The book is definitely a 5 Star pick if you're interested in the topic of energy, EROI, and detailed econometric analysis. And, you'll learn a lot about the solar industry and associated technology.
Whether Spain (or Germany) made the right investment in terms of scale, timing and other factors remains to be seen. Lazard has released the 10th version of their report, on the Levelized Cost of Energy Analysis, which shows much lower costs of solar today than was available in the period covered by Hall and Preito's study. (Note that while the Lazard studies are consistent year to year, they do not use the same broad framework of Hall's work. Other analyses of EROI of solar come out in the range of 6 - 8 vs this calculation of 2.45, however many of them are not based on actual measured power or performance of the solar plants). Also, as noted above in the discussion of gas turbines, it is not as though the massive infrastructure can be replaced with the newer technology without essentially absorbing all the costs that were planned to be amortized over 25 years into a much shorter time period. Doing so would make any idea of replacement cost prohibitive, and as such this study's conclusion of an EROI of 2.45 raises questions of whether this huge investment by Spain at this time and at this scale was a good decision. Perhaps, if the cost of utility scale implementations was dropping as fast as the Lazard study suggests - from $350/MWh in 2009 to $50/MWh in 2016 - then Spain is paying a huge first mover cost and could have made much better investments had they been spread out over time to take advantage of advances in technology.
A different look at the energy pyramid is the following, which raises the question whether our current replacements for fossil fuels are adequate to support the standard of living we're expecting for the future, which is why this type of analysis needs to be part of the decision framework when discussing renewables. Being trapped with a energy production system that has the EROI of a hunter gatherer society is probably not the best.
