Tuesday, July 10, 2012

Your Friend, Vitamin D

Did you know up to 69% of children and 77% of adults in the US are deficient in Vitamin D?

Did you know that insufficient or deficient Vitamin D is linked to:

  • Cancer
  • Cardiovascular disease
  • Overall mortality
  • Diabetes
  • Autoimmune diseases
  • Alzheimer's / Dementia
  • Stroke (lower D, higher severity), and 
  • Multiple sclerosis

What should you do?   Get your Vitamin D level checked!

And learn more at sites like these:

http://vitamindhealth.org/

http://www.vitamindcouncil.org/


Sunday, July 8, 2012

Scallop Stew Adventure

I've never made this before, and I did not read any recipes...

I had 1lb of frozen scallops that I thawed and considered grilling them.  However, I also needed some lunch food for the upcoming work week.

Here's the starting materials:  Asparagus, Onion, Garlic, Tomato, Golden Beet, Red Potato, Brussel Sprouts, Coconut Milk, Scallops.


Clean and chop (and peel) the asparagus and beet.


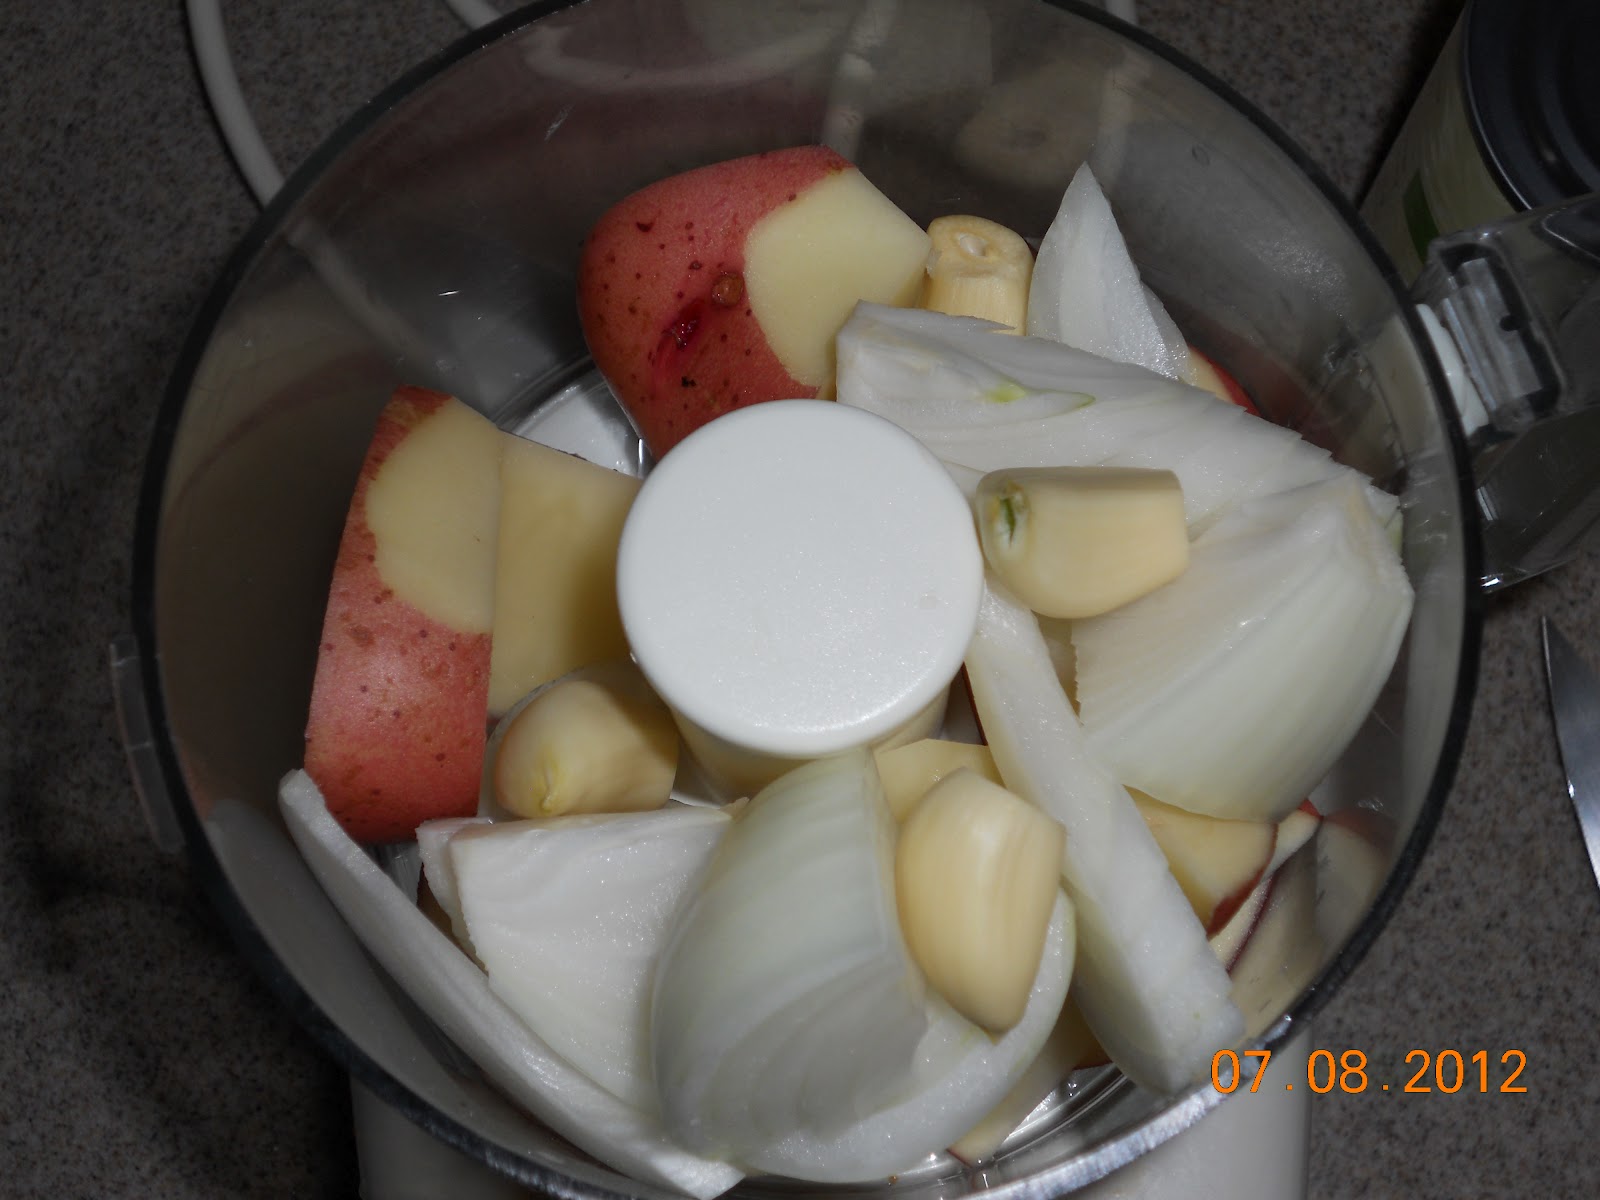
Put the potato, 1/2 of the vidalia onion, and 4 cloves of garlic in the food chopper thing.


Lucy came in to help out.


Dice the tomato and brussel sprouts.


Add spices - in this case, kelp w/cayenne, red pepper flakes, and black pepper.


Put it all in the crock pot with 2 cans of coconut milk.  Add about 1/2 can of water.


Stir it up, set the slow cooker on Low, and wait ~4-5 hours.

Here's the breakdown of this meal according to Nutrition Data dot Com.   (I'm assuming that this makes 3 bowls).

Calories:   1027
Fat:           77g  (63%)    - 66g saturated fat - yay!
Protein:     47g  (17%)
Carb:         50g  (20%)


Omega 6:3 ratio ~1.7 : 1   (pretty good)
Omega 3:    627mg
Omega 6:  1061mg


Vitamins
Amounts Per Selected Serving
%DV
Vitamin A
2468
IU
49%
Vitamin C
42.4
mg
71%
Vitamin D
~
~
Vitamin E (Alpha Tocopherol)
~5.3
mg
~27%
Vitamin K
~96.4
mcg
~121%
Thiamin
0.6
mg
43%
Riboflavin
0.4
mg
24%
Niacin
7.8
mg
39%
Vitamin B6
0.7
mg
35%
Folate
401
mcg
100%
Vitamin B12
1.8
mcg
30%
Pantothenic Acid
~1.5
mg
~15%
Choline
~210
mg
Betaine
~33.5
mg


Minerals
Amounts Per Selected Serving
%DV
Calcium
287
mg
29%
Iron
12.3
mg
68%
Magnesium
257
mg
64%
Phosphorus
986
mg
99%
Potassium
2610
mg
75%
Sodium
490
mg
20%
Zinc
8.0
mg
53%
Copper
1.8
mg
88%
Manganese
~3.5
mg
~176%
Selenium
71.0
mcg
101%
Fluoride
~39.8
mcg


Also note, the Kelp added about 3mg of Iodine


Saturday, July 7, 2012

A couple salads

I've been feeling like I should eat more salads, so here are a couple from the past 2 days.

Salad 1:  Spinach, shallot, heirloom tomato, carrot, and beef brisket (from, of course, Whole Foods).  The dressing was a ginger teriyaki from Ginger People.


Salad 2:  Spinach, shallot, heirloom tomato, olive, baked bacon, and a hard boiled egg.  I made the dressing out of olive oil, ginger, cayenne pepper and black pepper.


Friday, July 6, 2012

Grilled grass fed beef, sweet potato, kale, asparagus, shallot

Here is last night's dinner.  This one was inspired by Paul Jaminet's Perfect Health Diet.  I just started reading the book. Sweet potatoes are what he calls "safe starches".   I cooked the veggies on low heat for about 20 minutes.  I put about 4 tbsp of coconut oil in the pan to keep things from sticking.  More to follow on coconut oil and Jaminet's book in another post.


Thursday, July 5, 2012

The Kitchen Sink

I'm not exactly sure what to call this dish.  I failed to thaw some grass fed beef, so I had to improvise for dinner.  I started with 1/3 lb organic Berkshire pork sausage (from Riverview Farms) fried in about 2 tbsp of bacon grease.  Then, I added a cup of leftover veggies from the night before.  Brussel sprouts, kale, shallot, cauliflower - which were cooked in ghee the previous night.  Then I took 3 eggs and 2 oz of fresh spinach.  Mixed that all up, and added the eggs/spinach to the mix.  Cooked it for a few minutes on the stovetop, and then switched to the oven at 350 for about minutes.  Then added 1 slice of New Zealand grass fed cheddar.

It looks kind of disorganized, but it ended up tasting quite good.

 
Here's the cast iron pan used to produce this dish.  (Thanks Mom)


Friday, June 29, 2012

Pullups... Part of the Paleo Lifestyle

One book I highly recommend is Mark Sisson's 21 Day Total Body Transformation

In it, he suggests that men should have a goal of 12 pullups.  They are a key measure of upper body strength.  Also, at least when I say pullup, I mean palms facing away and not all that "swinging" or "kipping" or other tricks.  Nope, just raise and lower.  Simple.

Pullups are a weak area for some people, but I suggest that the only way to build up to doing12 is to do some during every workout, or at least quite frequently.  I do most of my weight lifting exercises on Mon, Weds, Fridays.  On the weekends, I tend to be out hiking in the Georgia mountains with my dogs.

Currently, my maximum is 13 pullups, but it did not used to be that way.  Well actually, it used to be better, and then it got slowly worse, and then it was horrible, and now I'm headed in the right direction.  Here's a short history of my life of pullups:

Age      Pullups
21          17     -  Was young, used to be a swimmer...
31            8     -  Look what 10 years of not doing pullups will do
37            3     -  Injured shoulder painful.  Learned about the Supraspinatus
45            13   -  Look what doing pullups in your workout routine can do after 18 months.

I keep a log of all my workouts, so the first graphs is monthly totals for the past year - An average of 389 pullups per month.  You'd think hitting 500+ pullups in a month would be easy... but it hasn't been that way for me.  Especially if you skip a day or two.

My inspiration for working out is Shana A. of Crossfit East Decatur.  I don't belong to her gym, but I do follow along on the facebook page and CFED Web Site.  Once I saw a workout where she must of have done >80 165 pullups in the WOD.  That's a ton in one short 20 minute period....

My goal by my birthday in August is a max of 15.  Who knows, I might even try to get to 17 by then.


This is the prior year - Average of 119 per month.  There were a couple months during this year that I traveled internationally, so I basically missed the whole month of November.


Thursday, June 28, 2012

Climate Central - A Failure in Graphics and/or Statistics

Recently, Climate Central issued a new report that discussed warming across the continental US over the past 100 years.  In this report, the graphics and commentary are extremely misleading.  For example, even though 1/2 of the state's climate trend did not meet statistical relevancy, the created every single chart as if it did.

In their original graph - note the "warming rates accelerated everywhere" title.  This is cherry picking of the data.  In fact, their statistically insignificant data showed that Alabama, Arkansas, and Georgia COOLED.  (Not that I believe it).  In one case, the "warming" was by 0.008 degrees.  Whew...  I'm fixin' to pass out!


Anyway, here is my revised graph using only the data that was statistically relevant (see footnote in table 3 of the report that you can download [Heat Is On Report].  If you're going to make a point, you have to use honest graphics.  So, yes, there is some real warming... but not in 1/2 of the states.


Next, they tried to show which states were warming the fastest.  Of course, the title of the chart uses the terms "10 Fastest Warming States" and "10 Slowest Warming States".    I corrected that for them, too.


Take a look... Last I heard, when something was declining in temperature, you don't call it warming.  There's another word for that.  Cooling?  Of course, since the data was statistically insignificant, why even create this graphic?

I'm a huge fan of Edward Tufte.  Visual Display of Quantitative Information  Whomever created the graphics for the Climate Central report really should find some of his work and use it to improve the way they display data.  As Tufte said in a seminar I attended, "Clear drawings are clear thinking..."  We could all use more of that.